From LTT845 16 May 2022
LTT Columnist’s Commentary
Phil Goodwin
Important and Credible Fuzzy Projections by the Department for Transport - but still Fuzzy Thinking about Stonehenge
Precision about future transport and travel patterns is impossible, though targets for meeting climate change and net zero commitments must be treated as achievable and necessary, says Phil Goodwin. He is concerned that ‘fuzzy’ DfT projections, whilst inevitable, have provided freedom for mis-representation and inconsistent application in project-specific calculations.
THE CLASSIC CASE for ‘fuzzy’ analysis is that it corresponds with the world, and especially human experience. The difference between ‘short’ and ‘tall’ is genuinely useful, no less so because there is only an arbitrary and changeable dividing line between them. Statistical error bands are inherent to nearly all measured data, and it is useful to have analytical frameworks which recognise that. Similarly, uncertainty about the future is also inherent, so any predictions, however apparently precise, must always have a fuzzy area around them. On the other hand, the fuzzy area between ‘truth’ and ‘lies’ can be really problematic, as we know to our cost, and the fuzzy area between ‘success’ and ‘failure’ is rarely treated with insight and honesty.
The figure on this page is an extraordinarily important contribution to decarbonisation. You have probably noticed it before, and it will keep cropping up in different places. It takes the inherent fuzziness about statistics, and about the future, and converts them into elegant art. I think it will be at the centre of all future controversies about base-line forecasts, scheme and policy appraisals, compatibility with carbon and congestion objectives, and the effectiveness of solutions.
But it is open to a very special sort of misinterpretation, which I will argue affects its most recent use, by National Highways in defence of their Stonehenge proposal. Their fuzziness is not about inherent uncertainty, but the failure of thought, in how to deal with mutually exclusive alternatives.
So first let’s clarify exactly what the figure is saying. It appears on page 45 of the DfT’s ‘Decarbonising Transport: A Better, Greener Britain’.

[National Highways] fuzziness is not about inherent uncertainty, but the failure of thought, in how to deal with mutually exclusive alternatives
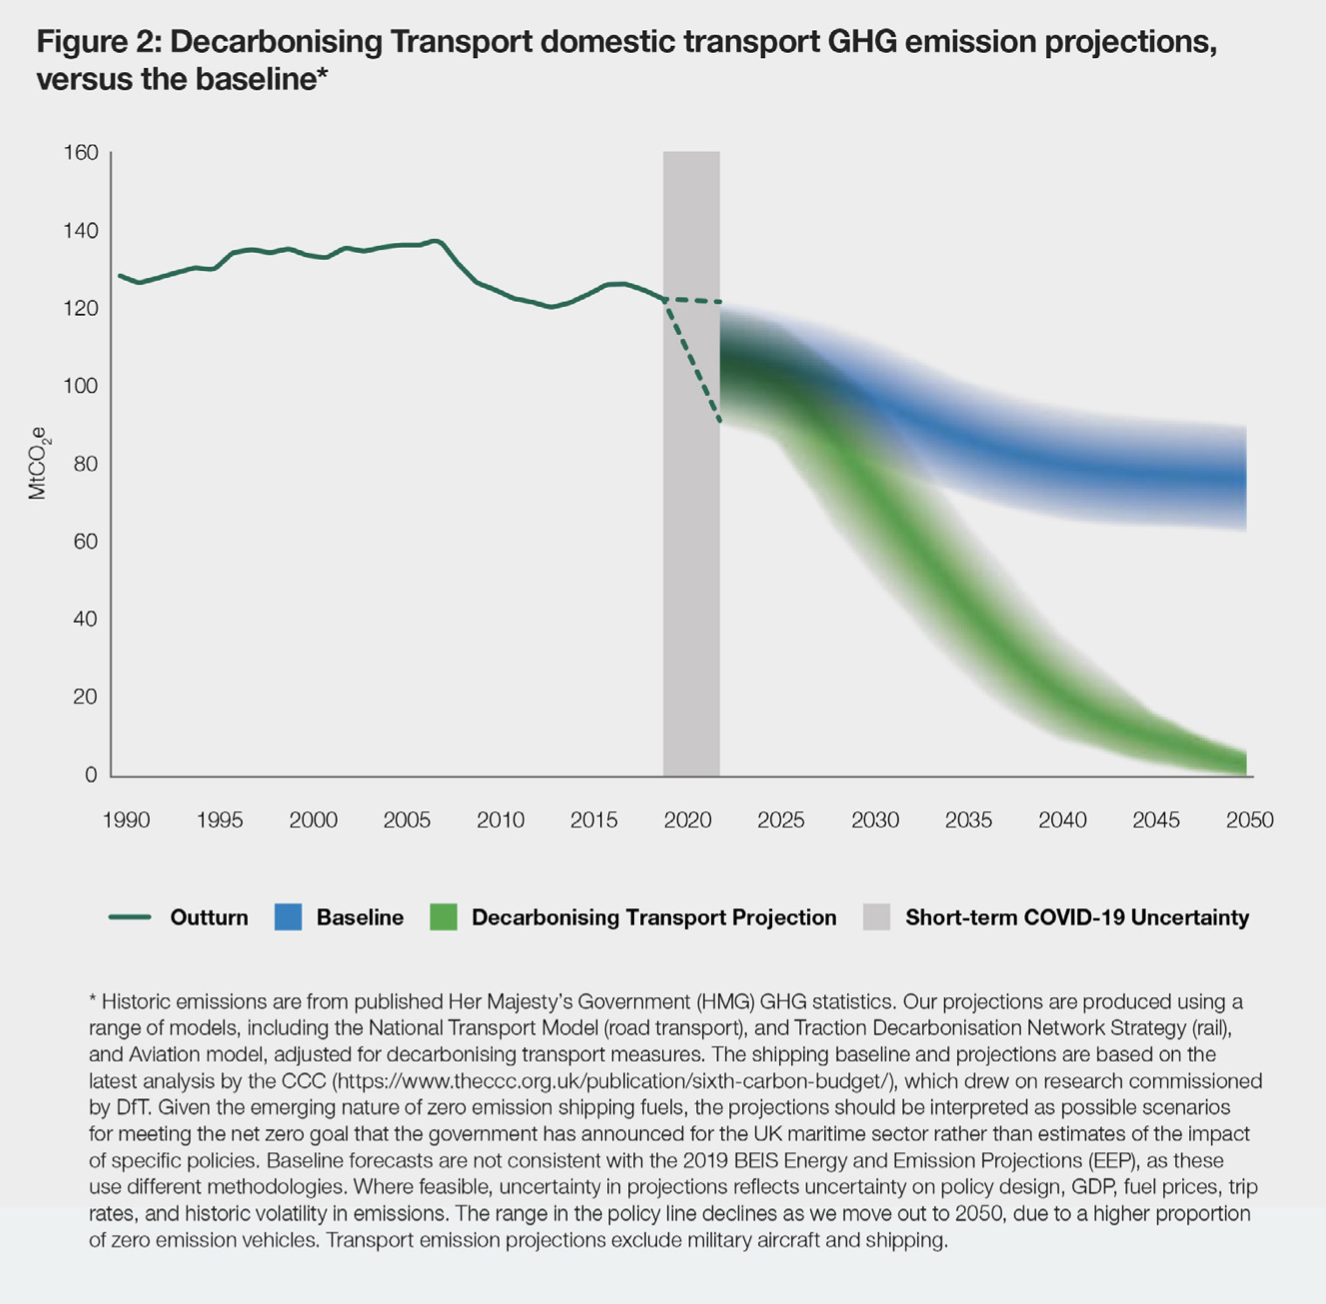
The Y-axis here shows the estimated national total of greenhouse gas emissions (mostly carbon dioxide). The ‘out-turn’ line shows the estimate of what has really been happening, since 1990 – a well-defined line, hardly fuzzy at all, of slow increase, followed by a dip, rise, downturn, and then Covid. The blue fuzzy line shows what DfT estimates is a future ‘baseline’, of what would be likely to happen without the ‘Decarbonising Transport’ policies and initiatives, somewhat related to ‘business as usual’ or ‘the do-nothing option’.
The green fuzzy line shows the DfT 2021 estimate of the combined effect of all the decarbonising transport initiatives they propose, but not yet in place. This trajectory, according to DfT’s estimates, would be compatible with our carbon commitments, or at least the lower bound of it would be. The calculations are all model and evidence based, not just impressionistic. The legend says ‘a range of models’ were used, including the latest (not yet published) version of DfT’s own National Transport Model, used for national road traffic forecasts, which are embedded within the projections in a more advanced form than was the case for the last published road traffic forecasts, in 2018.
Thus behind the projections are traffic figures, detailed computer outputs, assumptions, scenarios and adjustments. These are typically published alongside such forecasts, though have not yet been published for scrutiny in this case. Professor Greg Marsden, for the ‘DecarboN8’ network of Northern Universities, has put in a Freedom of Information request to the DfT for this information, so far refused (whose progress can be seen here). I do hope he’s swiftly successful. The diagram is vitally important, and only limited use can be made of it without that information. There must exist a series of tables, leading to another diagram, in similar format, where the traffic figures are given which correspond to the CO2 figures.
Some of their main features can be inferred from the information has been published, which enables us to make some definite statements, which is the point of this column.
The first definite statement we can make is that the blue trajectory is not compatible with our carbon commitments. Importantly, DfT explicitly acknowledges this.
The second definite statement is that the green projection is largely due to the progressive replacement of fossil fuels by electricity, rolling out as electric vehicles replace petrol and diesel ones, but DfT explicitly accepts that this is not enough: it is also necessary to provide for a significant amount of road traffic reduction. These are calculated to be achievable from specific policy measures, listed in ‘Decarbonising Transport’ which have not previously been included in traffic forecasts.
They include active travel measures aimed at securing 50% of all urban jurneys to be made by walking and cycling, as part of the objective to “make public transport, cycling and walking the natural first choice for all who can take it “, as the Secretary of State for Transport wrote in his own introduction:
“It’s about using cars less, not giving them up completely...We want to reduce urban road traffic overall. Improvements to public transport, walking and cycling, promoting ridesharing and higher car occupancy, and the changes in commuting, shopping and business travel accelerated by the pandemic, also offer the opportunity for a reduction or at least a stabilisation, in traffic more widely” (My emphasis).
This would be a hugely significant change in the policy environment, as well as in the practice of forecasting and appraisal. All this is promised in the green fuzzy line.
Now I have to accept that for the moment, some of that promise has to be taken on trust, but that trust is at least supported by the credibility of the green trajectory. For the modelling experts, I note that this is consistent with the use of a model of the matching of origins and destinations (a distribution model) in the forecasts, which allows calculation of the combined effect of shift of destination and shift of mode, so that – for example – there can be shifts from longer distance car journeys to shorter distance public transport and active travel journeys: that can be a significant source of carbon reduction, and means that what happens in towns affects what happens on the network between towns. Non-urban traffic is also affected by other initiatives proposed, including improvements to rail, intercity coaches, increased car occupancy, more sustainable freight movement, and the use of land use planning to enable less car dependent life styles.
Overall, therefore, the green trajectory is credible, if all the policy promises are delivered. The published trajectory, the list of policies, experience in practice, and the known competences of models are consistent with each other. So, I do believe that the modelling has been done and does show the results given, and that the fuzzy boundaries represent a realistic degree of the uncertainty still present. And, therefore, if the policies are not delivered, we are likely to remain on the blue trajectory, or worse.
One important remaining uncertainty is whether the inferred traffic reductions include an estimate of induced traffic from road schemes currently proposed in the RIS and local programmes. The line of argument and methodology described makes it appear not, but confirmation will be necessary.
The Stonehenge Riddle...
Now where does Stonehenge fit into this?
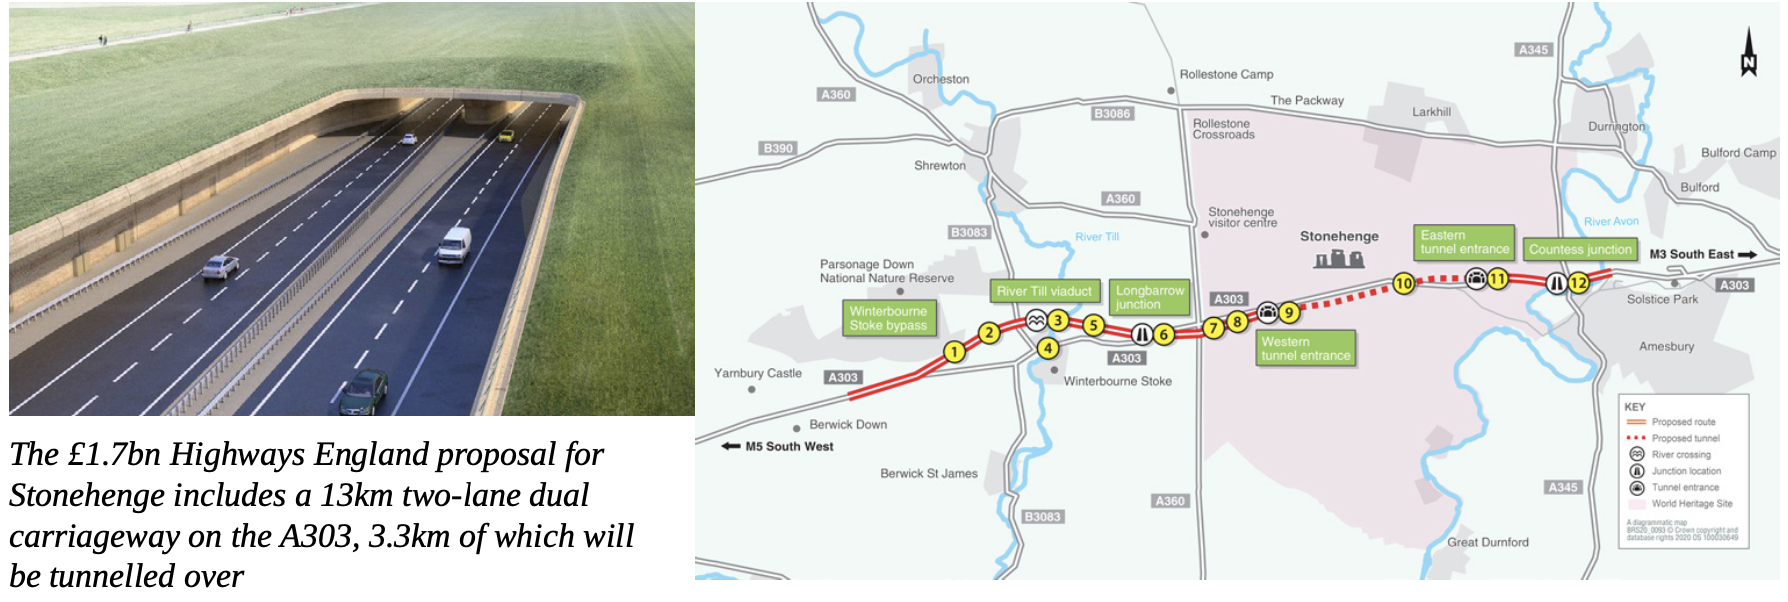
National Highways has for years promoted the construction of a new two-lane dual carriageway on the A303 between Amesbury and Berwick Down in Wiltshire, which they call the “A303 Stonehenge Scheme” for short. It is a part of their longer-term plans for road works on the whole of the A303 to the South-West, and involves a substantial tunnel under part of the Stonehenge Heritage Site. Variants of this idea have always been very controversial and high profile because of the importance of Stonehenge as well as the transport deficiencies in a strategy of expanding road provision to match forecast increases in road traffic.
It was put to an Examination in Public in 2019, and the planning inspectors recommended rejection of the scheme, because of the serious and irreversible damage it would do to the Heritage Site. Critics of the scheme (including me) also pointed out that the claimed time savings to road users were not nearly enough to justify the expense, a stated preference survey purporting that the scheme would deliver a £1 billion of ‘heritage benefits’ was deeply flawed, the costs had risen, and inclusion of the new official higher ‘costs of carbon’ would even further undermine any economic or environmental case.
Even so, the scheme was approved by the Secretary of State for Transport in 2020. That decision was overturned in a High Court challenge by objectors in 2021. He decided to ‘redetermine’ National Highways’ application despite the High Court judgment. National Highways’ updated case for doing so was published in April (see cover letter and document A303 Amesbury to Berwick Down: Secretary of State letter 24 February 2022).
The new case broadly takes as given most of their original argument and does not significantly respond to most of the criticisms made at the Examination in Public, but one new feature is that they rely quite heavily on the DfT’s fuzzy diagram and suggest that this strengthens their case.
My reading, however, is exactly the opposite, and I should explain why.
The long-established practice of road appraisal starts out with a forecast of what traffic conditions would be like without the scheme – usually, traffic growth and more congestion. The model is then run again, including the proposed scheme, to see what difference that would make – usually, traffic growth but less congestion. The time savings from anticipated congestion relief are usually the biggest element of benefits. Induced traffic will reduce the congestion benefit somewhat, and also adds some carbon which reduces the overall benefit further. A loophole dating back to 2014, says that if the carbon increase would be not so significant as to affect the Government’s ability to achieve its carbon targets, then this need not be a reason for rejecting the scheme. Thus, if the Government could offset any carbon increase by some other extra reduction elsewhere, the carbon impact can be dismissed. (Though it should still be included in the cost benefit calculations, which is a separate issue.)
The Stonehenge appraisal uses a baseline traffic forecast which is broadly based on the same approach as the DfT blue trajectory. That is incompatible with the carbon targets, (as is now explicit) and includes substantial traffic growth. That is the source of the rather small-time saving benefits claimed for the scheme. What the DfT trajectories now do – which was not the case before – is demonstrate that there is indeed a way that the extra carbon produced as a result of the scheme can be offset by other initiatives elsewhere, and DfT now lists specifically what would be necessary to do so – i.e. follow the green pathway.
Thus, the equivalent of the blue pathway is used to justify the ‘need’ for the scheme - i.e. the congestion due to its increased traffic. And the green pathway is used to demonstrate that there are still ways of meeting the carbon targets – now much more concretely and specific than previously.
There is one huge logical error in this. The two pathways are mutually exclusive. If we follow the green trajectory, carbon problems will be less, but so will traffic growth, which reduces or overturns the need for the scheme. To say ‘we will assume traffic growth to justify the scheme and traffic decline to achieve the carbon savings’ is to make two directly contradictory assumptions.
With two mutually exclusive trajectories, we can envisage two different appraisals. Does this scheme make sense in a future of traffic growth and carbon failure? And does this scheme make sense in a future without traffic growth, and carbon success? The second is – surely – by far the most important, to a government that is seriously committed to delivering its own carbon plan.
There are other implications of the fuzzy approach. Broadly speaking the historic trend is not an uncertain fuzz, it’s a single clear line (subject to some uncertainties in measurement). Therefore year by year a fuzzy band collapses into a single well defined point on the ‘outturn’ line. But the two fuzzy curves – the present course, and the desired one – overlap, not clearly diverging until nearly 2035. So it’s not for another ten years, just comparing the solid outurn and the fuzzy trajectories, that we would be able unambiguously to judge ‘are we on course or are we not?’. We need, I would say, an annual update, not the five yearly that DfT has incomprehensibly suggested.
The other thing fuzzy is not good for is distinguishing between urgent and non-urgent. The acceptable green trajectory has a width of up to ten years, which is no use at all for those targets which relate to 2025 or 2030 or any other specific target. So the green wave tells us where we could be, but not where we want to be. Collapsing the vague direction into a specific path will require continually narrowing the bands, and very close scrutiny, in real time, of exactly where we are now. Swift delivery of the initiatives, and clear monitoring of the results, must be precise, not fuzzy.
Further contributions on the issues raised are welcome. Please send to hello@lttmagazine.co.uk
Phil Goodwin is Emeritus Professor of Transport Policy at UCL and UWE, and Senior Fellow of the Foundation for Integrated Transport.
Email: philinelh@yahoo.com
(c) 2022 LTT Magazine and lttmagazine.co.uk